

Aerostich Rideable Days Poster
4162
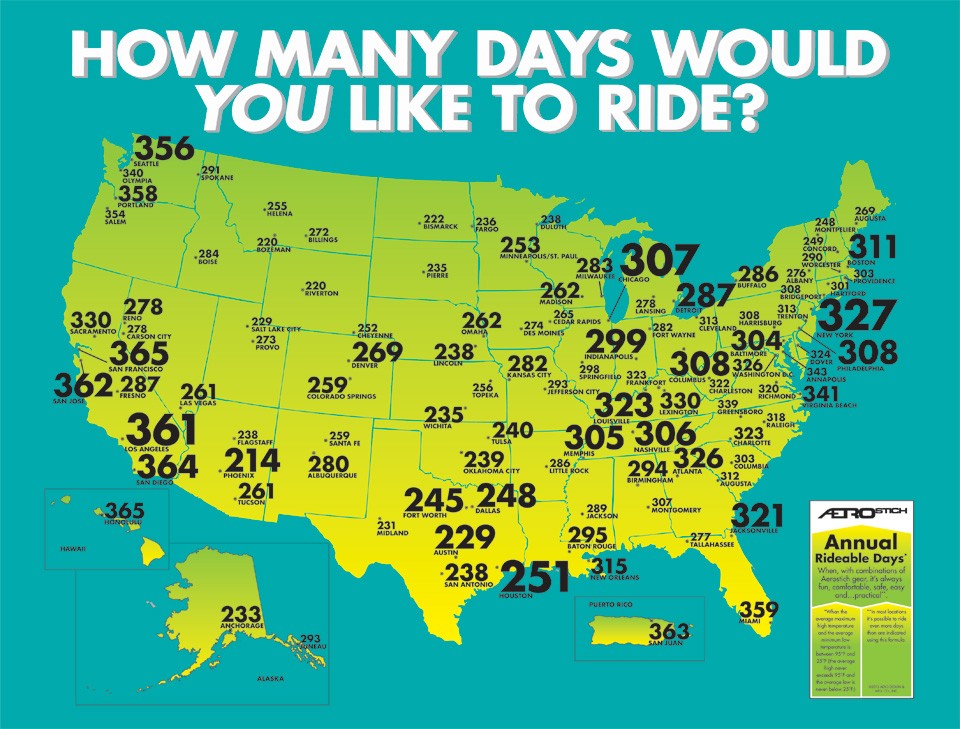
How many days would you like to ride? Based on a formula that includes selected ambient temperature ranges when riding with Aerostich gear, this colorful map portrays a fascinating representation of the annual number of rideable days easily achievable annually throughout the United States. 38"×26"
ABOUT THIS MAP...
Statistics for the average daily and seasonal temperatures in thousands of locations are available from the US Department of Agriculture to help farmers know what kinds of crops to plant and when to harvest.
The different sizes of the numbers on the map correspond to the populations of the cities listed. In other words, a large number like Los Angeles have a lot of people, and the average low and high temps used by this formula are seldom exceeded there, so this city has lots of ridable days. In contrast, cities like Phoenix AZ and Duluth MN each have different size numbers based on their differing populations, but similarly few ridable days because in those places so many days are by this formula on average either too hot or too cold.
The high and low temperatures used (95°F and 25°F / 35°C and -3.8°C) are based on the temperatures which are easy to dress for with Aerostich gear. It’s always been comparatively simple to ride through temperatures between 95°F and 25°F over urban distances.
– Mr. Subjective, 1-14
Pairs well with
- All in-stock Aerostich products and RiderWearHouse Catalog items ordered before 1pm CST will be shipped within 2 business days.
- If a specific size and color of Aerostich suit is not in inventory, we will notify you with an estimated delivery date. Production time varies.
- All standard Aerostich items may be sent back within 30 days of receipt for a refund, but the item(s) being returned must be in new condition.
Visit our shipping page for more information.